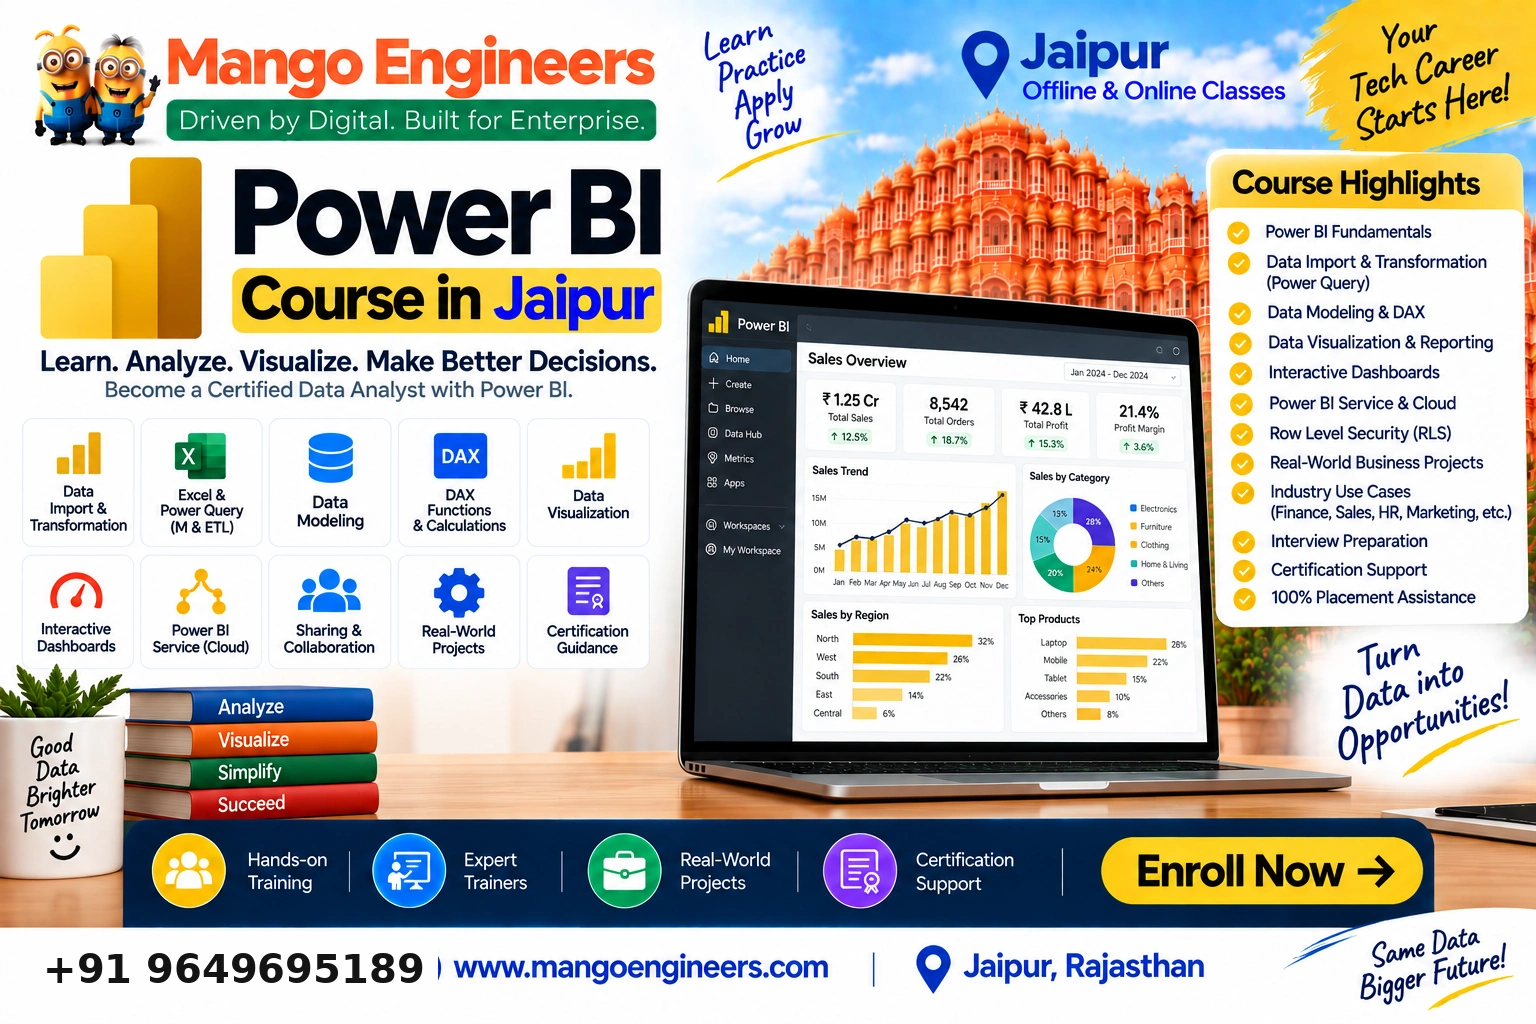

Build Practical Data Analytics Skills for Reporting and Decision-Making
Learn a complete analytics workflow covering spreadsheets, SQL, Python and Power BI. The track is designed for students, freshers and working professionals who want to analyse data, build dashboards and present business insights clearly.
End-to-End Analytics
Move from raw data and spreadsheets to SQL querying, Python analysis and dashboard reporting.
Practical Reporting
Work with real-world style datasets, cleaning, summaries, KPIs and visual reporting.
Tool Stack
Use Excel/Advanced Excel, SQL, Python and Power BI in one connected learning path.
Career Preparation
Build project work suitable for portfolio discussion and entry-level analytics interviews.
Who This Course Is For
- Students and freshers targeting entry-level data analytics roles.
- Working professionals who want stronger reporting and dashboard skills.
- Learners from non-programming backgrounds who want a structured analytics path.
- Business, commerce, engineering and computer-science learners working with data.
What You Will Be Able to Do
- Clean and analyse data in Excel and Advanced Excel.
- Write SQL queries to extract, filter, join and aggregate data.
- Use Python for data manipulation and basic analysis.
- Build interactive Power BI dashboards and KPI reports.
- Explain findings using clear business-focused visualisation and reporting.
Course Curriculum
Excel & Advanced Excel
- Formulas and functions
- Lookup functions
- Data cleaning
- Pivot tables and charts
- Conditional logic
- Reporting and dashboard foundations
SQL for Analytics
- SELECT and filtering
- Sorting and grouping
- Joins
- Subqueries
- Aggregate functions
- Analytical querying practice
Python for Data Analysis
- Python foundations
- Data structures
- Data handling workflow
- Pandas-style analysis concepts
- Cleaning and transformation
- Basic visual analysis
Power BI
- Data import
- Power Query concepts
- Data modelling
- DAX foundations
- Visuals and KPIs
- Interactive dashboards and reporting
Projects & Practical Work
Project difficulty is adjusted to the learner's level and batch progress. The goal is to turn concepts into demonstrable work rather than only complete theory modules.
- Excel business reporting project
- SQL analytics case study
- Python data-cleaning/analysis project
- Power BI dashboard capstone
Career Preparation
Mango Engineers' learning process can include project review, portfolio/GitHub readiness, resume guidance, mock interview practice and placement assistance. Placement assistance is support, not a job guarantee.
- Data Analyst
- MIS / Reporting Analyst
- Business Intelligence Analyst pathway
- Junior Analytics Associate
- Power BI Analyst pathway
Frequently Asked Questions
The approved structure combines Python ₹7,500, SQL ₹7,000, Excel/Advanced Excel ₹7,000 and Power BI ₹10,000.
No. The track can begin with spreadsheet and SQL foundations before progressing into Python-based analysis.
Yes. Power BI is part of the complete analytics path and is also available as a focused module.
Yes. The path includes reporting, querying, analysis and dashboard-oriented practical work.
No. Mango Engineers can provide career preparation and placement assistance, but employment is not guaranteed.